How to Use RSI Indicator for Better Trading Decisions & Profits!!
How to Use RSI Indicator
Introduction
If you are new to trading, the RSI indicator can feel like a helpful shortcut. It shows you whether a stock may be moving too fast upward or downward, which makes it easier to spot possible turning points.
Many beginners ask, what is RSI indicator and how can it help me? The answer is simple: it is a momentum tool that can improve timing and reduce guesswork.
Learn how to use RSI indicator, what is RSI indicator, and stock market institute basics in simple language for beginners.
What RSI Indicator Means
RSI stands for Relative Strength Index. It is a technical indicator that measures how strong recent price moves are.
You can think of it like a pressure gauge. When pressure gets too high, the market may cool down. When pressure gets too low, the market may bounce back.
Why Traders Use RSI
Traders use RSI because it helps them understand momentum in a simple way. Instead of guessing whether a stock is stretched too far, RSI gives a number that can guide your thinking.
It is especially popular among beginners because it is easy to read. You do not need advanced math to use it well.
How RSI Is Calculated
RSI compares average gains and average losses over a chosen period, usually 14 candles or 14 days. The formula is built into most charting platforms, so you rarely need to calculate it by hand.
What matters more is understanding the meaning of the number. The scale runs from 0 to 100, and that range tells you whether buyers or sellers are in control.
Basic RSI Levels
The most common RSI levels are:
- 70 and above: The market may be overbought.
- 30 and below: The market may be oversold.
- Around 50: The market is usually balanced.
These levels are useful, but they are not absolute rules. A strong stock can stay above 70 for a long time, and a weak stock can remain below 30 longer than you expect.
How to Read RSI on Charts
RSI usually appears in a separate panel below the price chart. When the line moves upward, buying momentum is increasing. When it moves downward, selling pressure is rising.
The real skill is not just seeing the number. It is learning to connect the number with the price movement on the chart.
Buy Signals Using RSI
One common strategy is to look for buying opportunities when RSI drops below 30 and then starts turning upward.
That does not mean you should buy the moment RSI touches 30. A better approach is to wait for confirmation, such as a support bounce, a bullish candle, or stronger volume.
Sell Signals Using RSI
A common sell idea is to watch for RSI above 70 and then wait for it to start falling. This may suggest that the rally is losing strength.
Still, it is important not to rush. Overbought does not always mean the price will fall immediately.
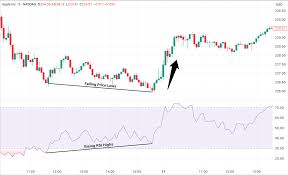
RSI Divergence
Divergence is one of the most useful RSI clues. It happens when price and RSI are moving in different directions.
- Bullish divergence: Price makes a lower low, but RSI makes a higher low.
- Bearish divergence: Price makes a higher high, but RSI makes a lower high.
This can warn you that a trend may be weakening even before the chart clearly turns.
RSI in Strong Trends
RSI behaves differently when the market is trending strongly. In an uptrend, RSI can stay above 50 and even remain above 70 for a long time.
This is why traders should not treat RSI as a standalone buy or sell switch. In trend markets, it often works better as a pullback tool than a reversal tool.
RSI in Range-Bound Markets
RSI is often more effective when the market is moving sideways. In a range, prices bounce between support and resistance, and RSI can help you spot those swings.
When price approaches the lower end of the range and RSI is weak, it may point to a possible rebound. When price nears the upper end and RSI is high, it may signal a pullback.
Mistakes Traders Make
Many new traders misuse RSI by treating it like a guaranteed signal. That is where mistakes begin.
Common mistakes include:
- Buying too early just because RSI is low.
- Selling too soon just because RSI is high.
- Ignoring market trend.
- Forgetting risk management.
- Using RSI without chart confirmation.
Tips for Beginners
If you are learning how to use RSI indicator, start simple. Keep the standard 14-period setting and focus on reading the basic levels first.
A smart beginner strategy is to combine RSI with support and resistance. That way, you are not depending on one indicator alone.
Combining RSI with Other Tools
RSI becomes stronger when paired with other tools like moving averages, trendlines, or volume. This helps you confirm whether a signal is meaningful or just market noise.
This is also why many learners at a stock market institute like Trendy Traders Academy are taught to study RSI along with price action. The combination gives a fuller picture than RSI by itself.
Final Thoughts
RSI is one of the easiest indicators for beginners to learn, but it still needs practice. It can help you read momentum, spot possible reversals, and avoid emotional decisions.
The best results come when you use it with context, not in isolation. Once you understand that, RSI becomes a practical and reliable part of your trading toolkit.
FAQs
What is RSI indicator?
RSI is a momentum indicator that shows whether a stock may be overbought or oversold.
What is the best RSI setting?
The standard 14-period RSI is the most common and beginner-friendly setting.
Can RSI work by itself?
It can help, but it works much better when combined with trend and price analysis.
Does RSI always give correct signals?
No, RSI can give false signals, especially in strong trending markets.
Should beginners use RSI?
Yes, RSI is one of the easiest indicators for beginners to learn and apply.